Example of the sklearn interface usage over the bosk pipeline#
Scikit-learn is a standart instrument that uses every data scientist, so probably you would like to get an adapter between bosk pipeline and a scikit-learn model. We’ve developed such classes for classifier and regression models.
Let’s make a classification bosk model.
[1]:
from bosk.executor.sklearn_interface import BoskPipelineClassifier
from bosk.painter.graphviz import GraphvizPainter
from bosk.pipeline.builder.functional import FunctionalPipelineBuilder
from sklearn.datasets import load_iris
from sklearn.model_selection import train_test_split
from sklearn.metrics import ConfusionMatrixDisplay
from IPython.display import Image
[2]:
n_estimators = 20
b = FunctionalPipelineBuilder()
X, y = b.Input()(), b.TargetInput()()
rf_1 = b.RFC(n_estimators=n_estimators)(X=X, y=y)
et_1 = b.ETC(n_estimators=n_estimators)(X=X, y=y)
concat_1 = b.Concat(['X', 'rf_1', 'et_1'])(X=X, rf_1=rf_1, et_1=et_1)
rf_2 = b.RFC(n_estimators=n_estimators)(X=concat_1, y=y)
et_2 = b.ETC(n_estimators=n_estimators)(X=concat_1, y=y)
stack = b.Stack(['rf_2', 'et_2'], axis=1)(rf_2=rf_2, et_2=et_2)
average = b.Average(axis=1)(X=stack)
argmax = b.Argmax(axis=1)(X=average)
roc_auc = b.RocAuc()(gt_y=y, pred_probas=average)
pipeline = b.build(
    {'X': X, 'y': y},
    {'labels': argmax, 'probas': average, 'roc-auc': roc_auc}
)
GraphvizPainter(figure_dpi=100).from_pipeline(pipeline).render('pipeline.jpeg')
display(Image('pipeline.jpeg'))

It’s a simple classification deep forest with 2 layers. Suppose we want to draw a confusion matrix for our pipeline. As we know, sklearn provides this functionality. So, let’s wrap our pipeline into the sklearn interface.
By default, BaseBoskPipelineWrapper associates the X, y and sample_weigth arguments of the fit method with the eponymous pipeline inputs. Output slots are expected to be named pred and proba. Thus, we need to specify mapping from the required pred and proba to our labels and probas outputs.
[3]:
sklearn_model = BoskPipelineClassifier(pipeline, outputs_map={'pred': 'labels', 'proba': 'probas'})
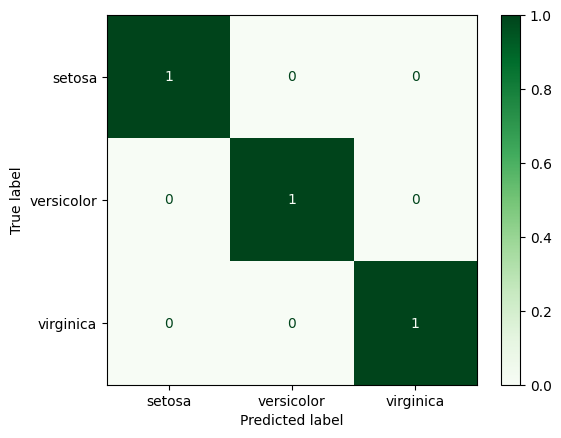
Let’s make some data, fit our classifier and draw the confusion matrix.
[4]:
iris = load_iris()
X = iris.data
y = iris.target
class_names = iris.target_names

X_train, X_test, y_train, y_test = train_test_split(X, y, random_state=42)
sklearn_model.fit(X_train, y_train)

ConfusionMatrixDisplay.from_estimator(
    sklearn_model,
    X_test,
    y_test,
    display_labels=class_names,
    cmap='Greens',
    normalize='true',
)
[4]:
<sklearn.metrics._plot.confusion_matrix.ConfusionMatrixDisplay at 0x7f62dae33d60>
